Advanced COVID-19 Analysis for the Whole US
- Purpose: This project was the continuation of a prototype made in collaboration with UChicago CSDS. The goal of this project was to create a tool that would allow for more advanced geospatial analysis of COVID-19 data.
- Role: Web application, data schema design, handling, engineering, academic research, visual re-design and data visualization.
- Outcomes: Interactive maps (Deck.gl), Research paper(s) and project website
- Context: Professional work, academic setting
Description
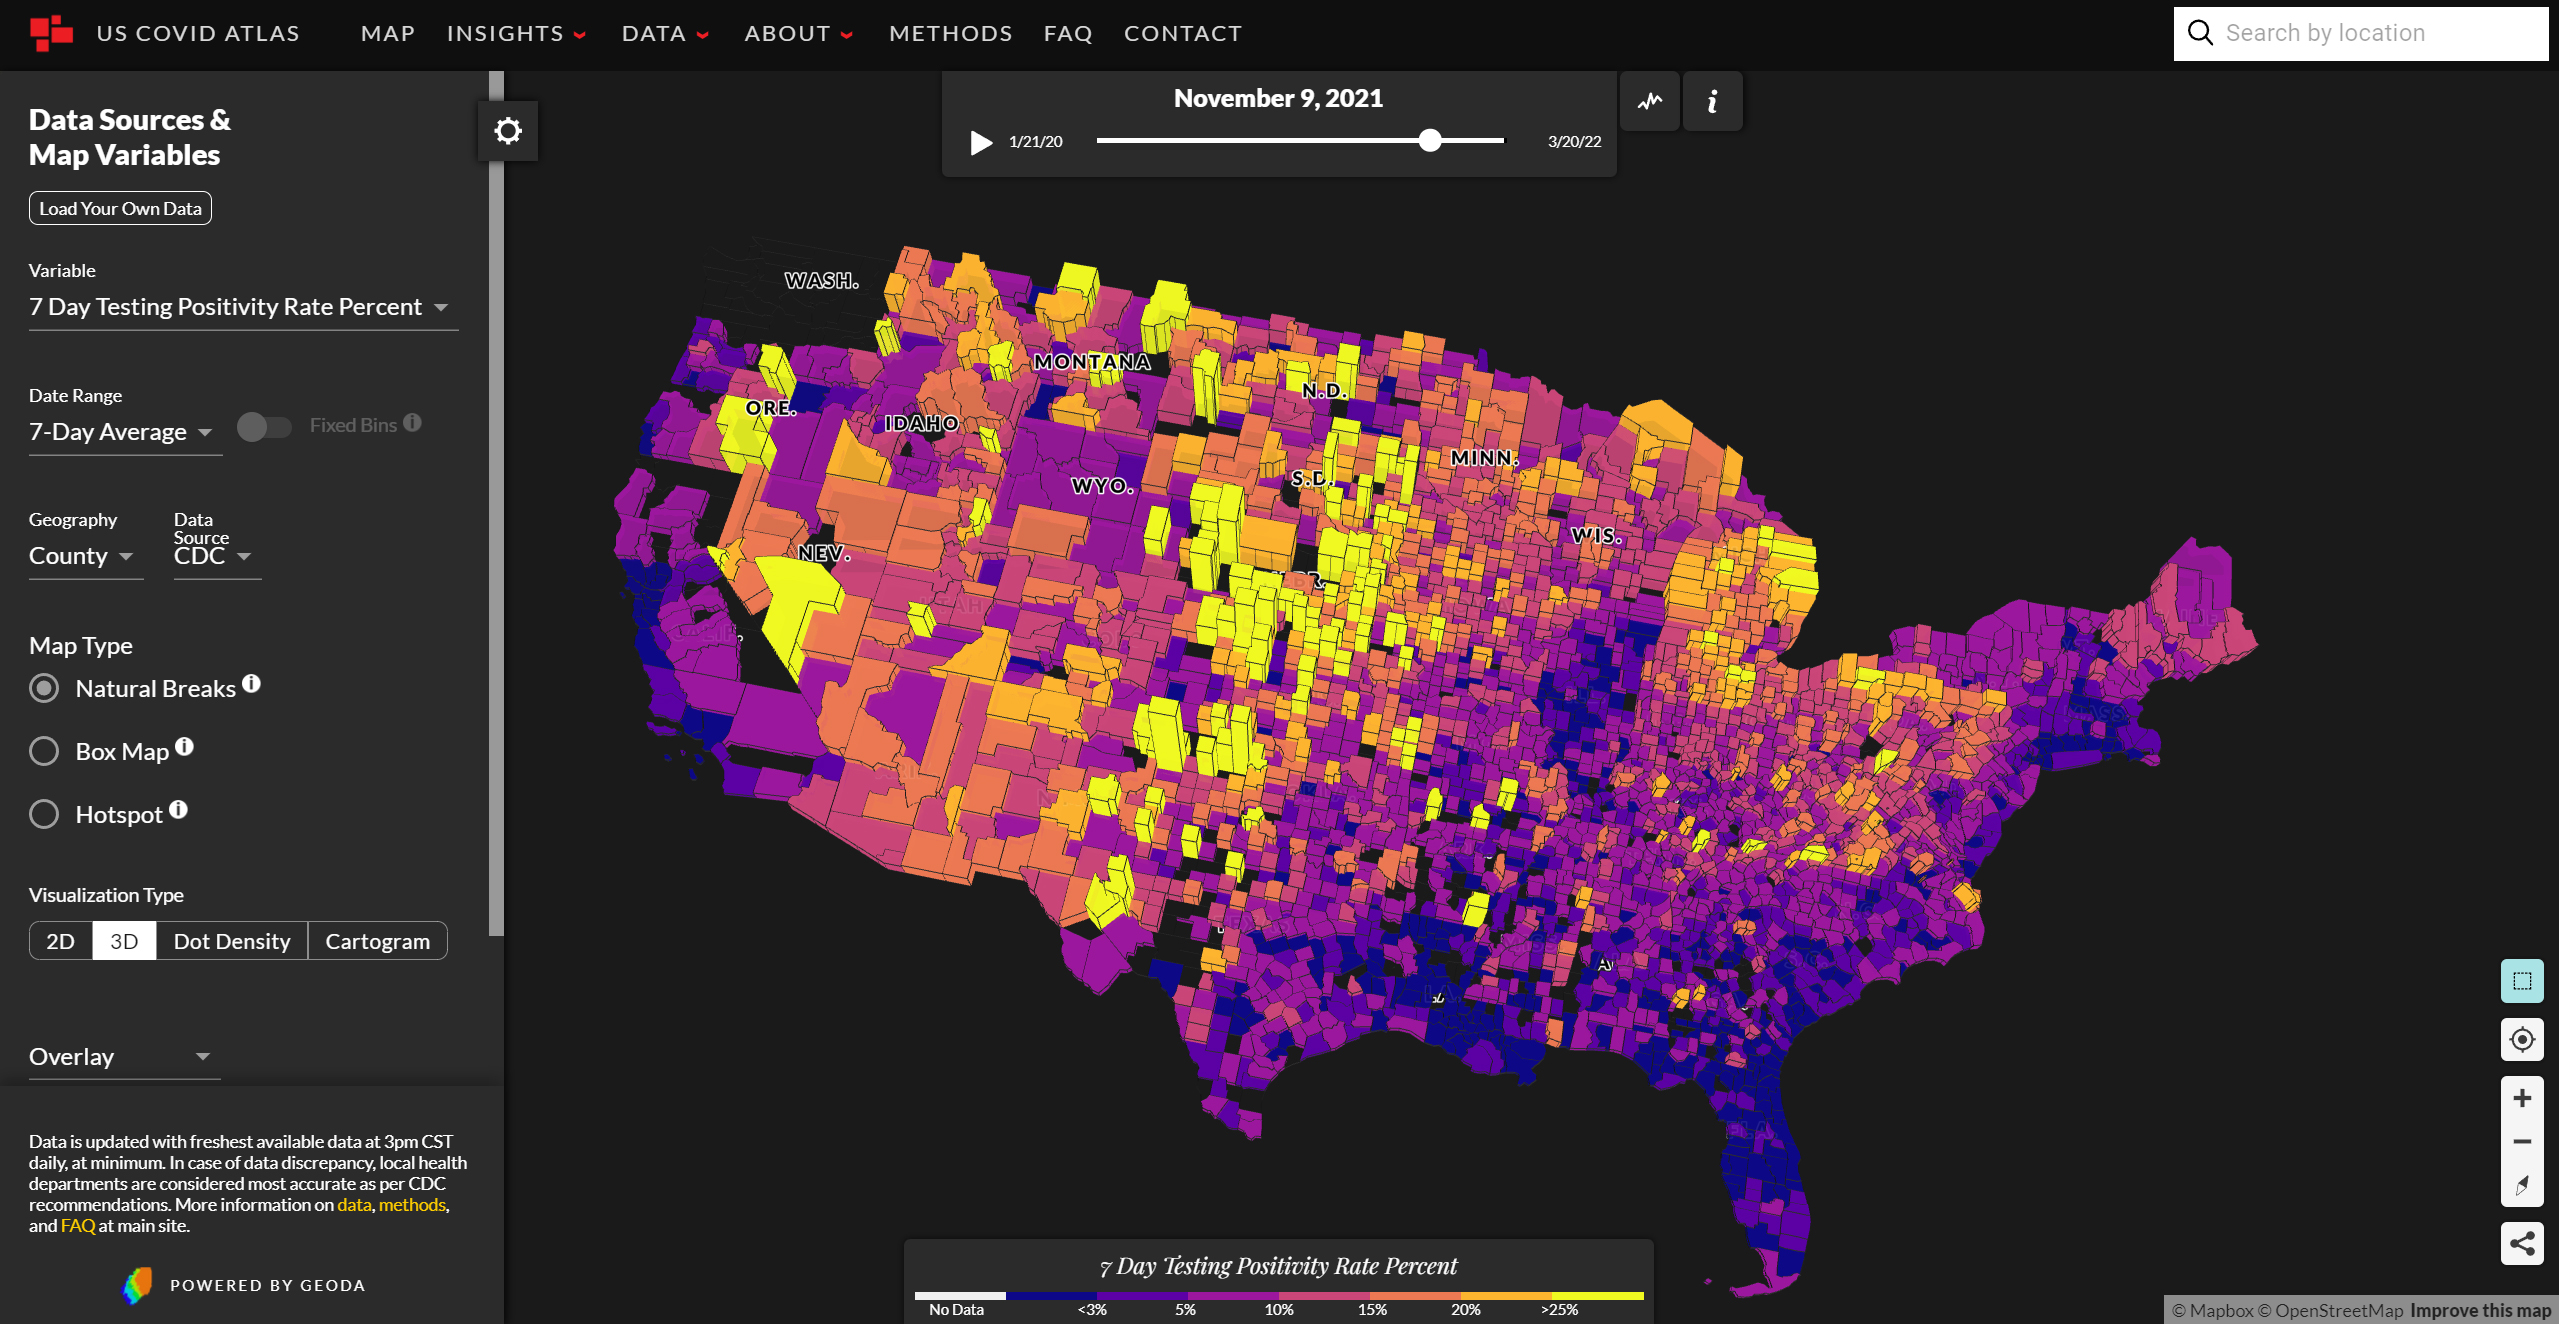
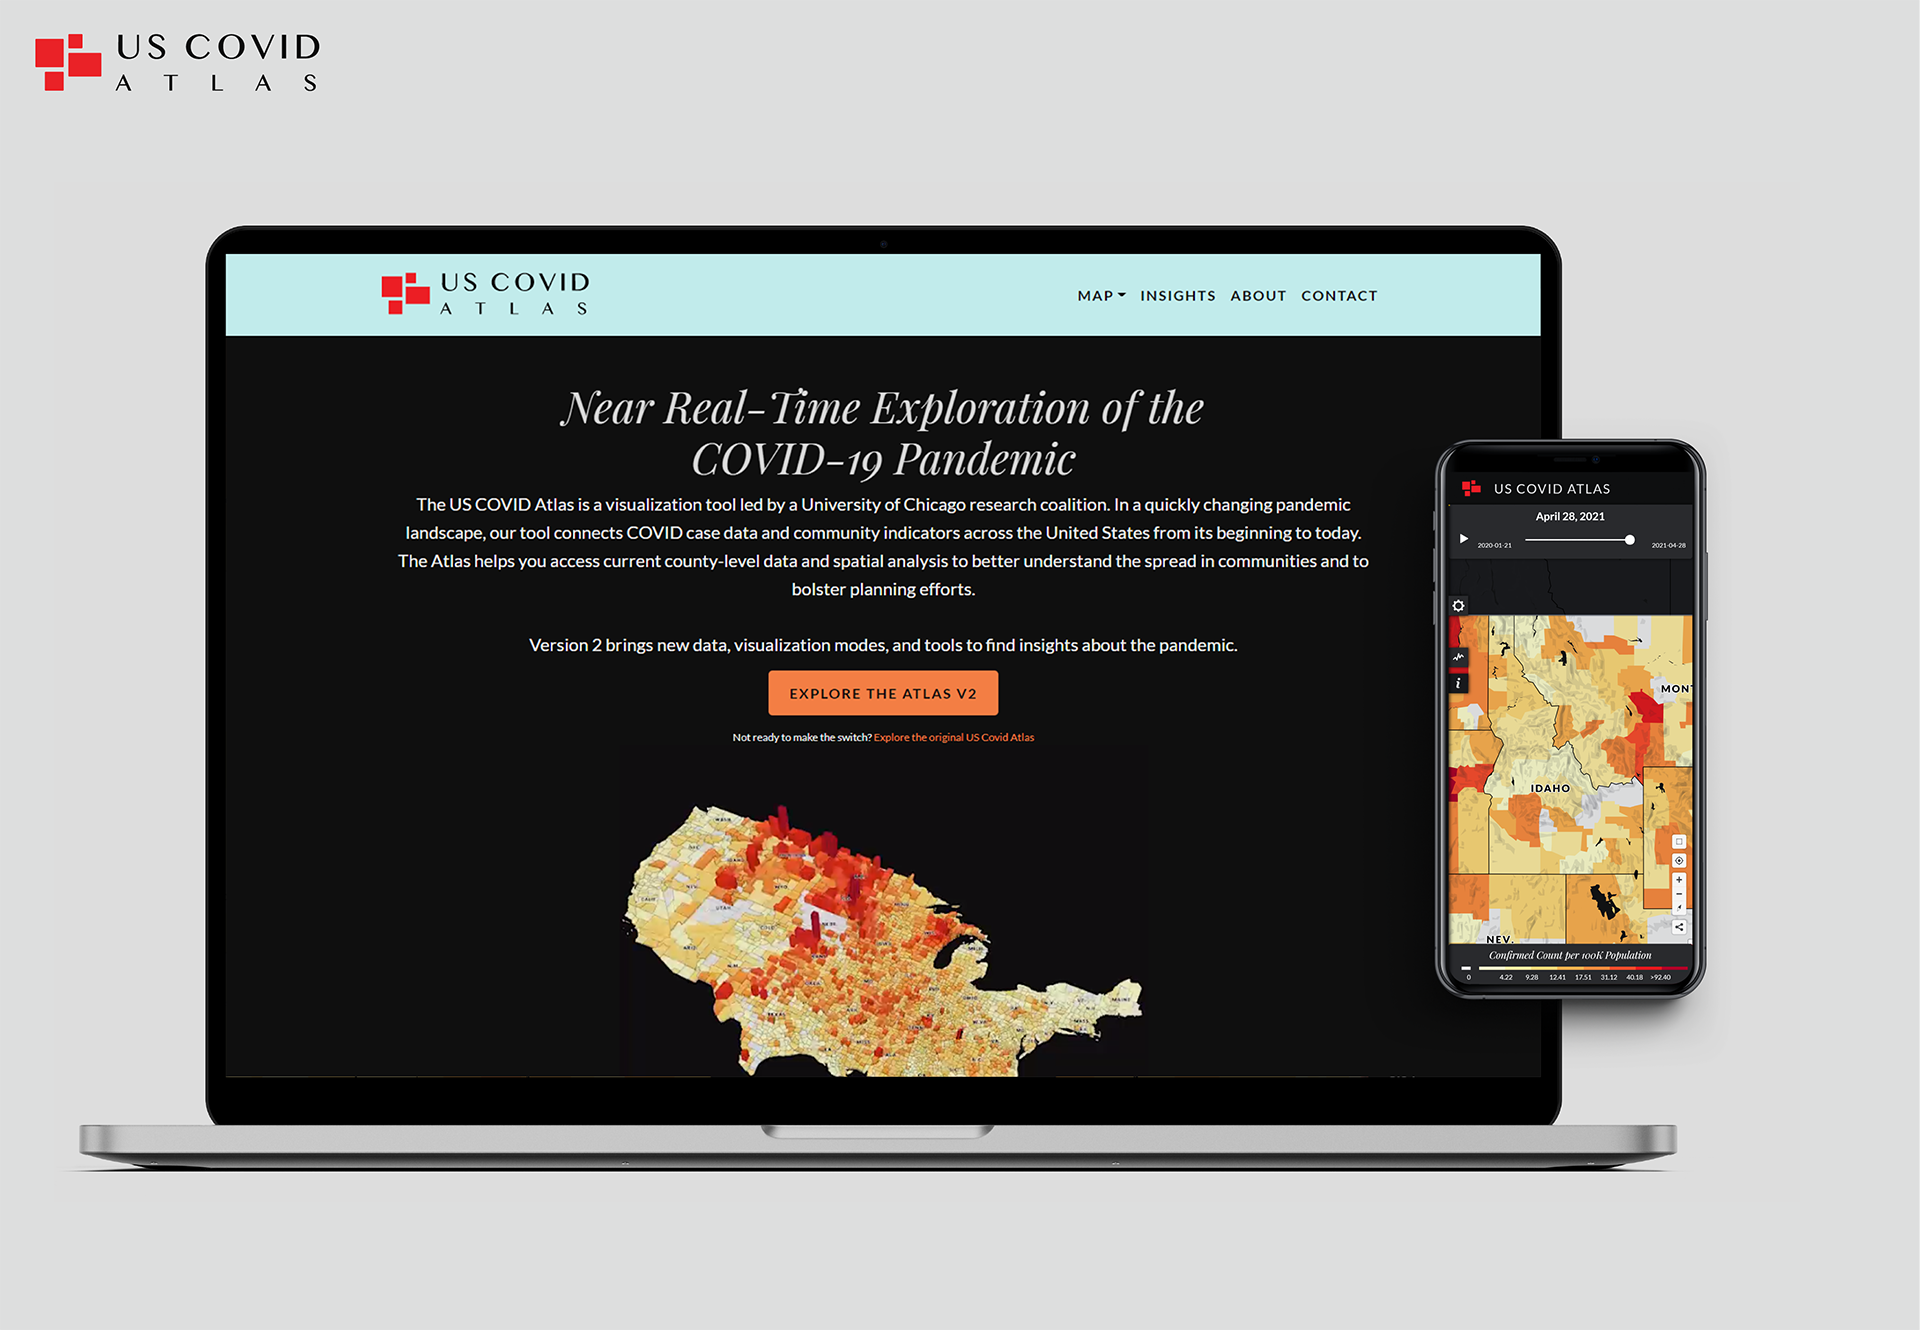
The US COVID Atlas is a visualization tool led by a University of Chicago research coalition.
In a quickly changing pandemic landscape, our tool connects COVID case data and community indicators across the United States from its beginning to today. The Atlas helps you access current, validated county-level data and spatial analysis to better understand the spread in communities and to bolster planning efforts.
My role in this project spanned across a huge range of research, design, and engineering challenges. I was repsonsible for the major refactors of the application to a hard-to-maintain vanilla Javascript site to a modern, parallelized and powerful React-based we application.
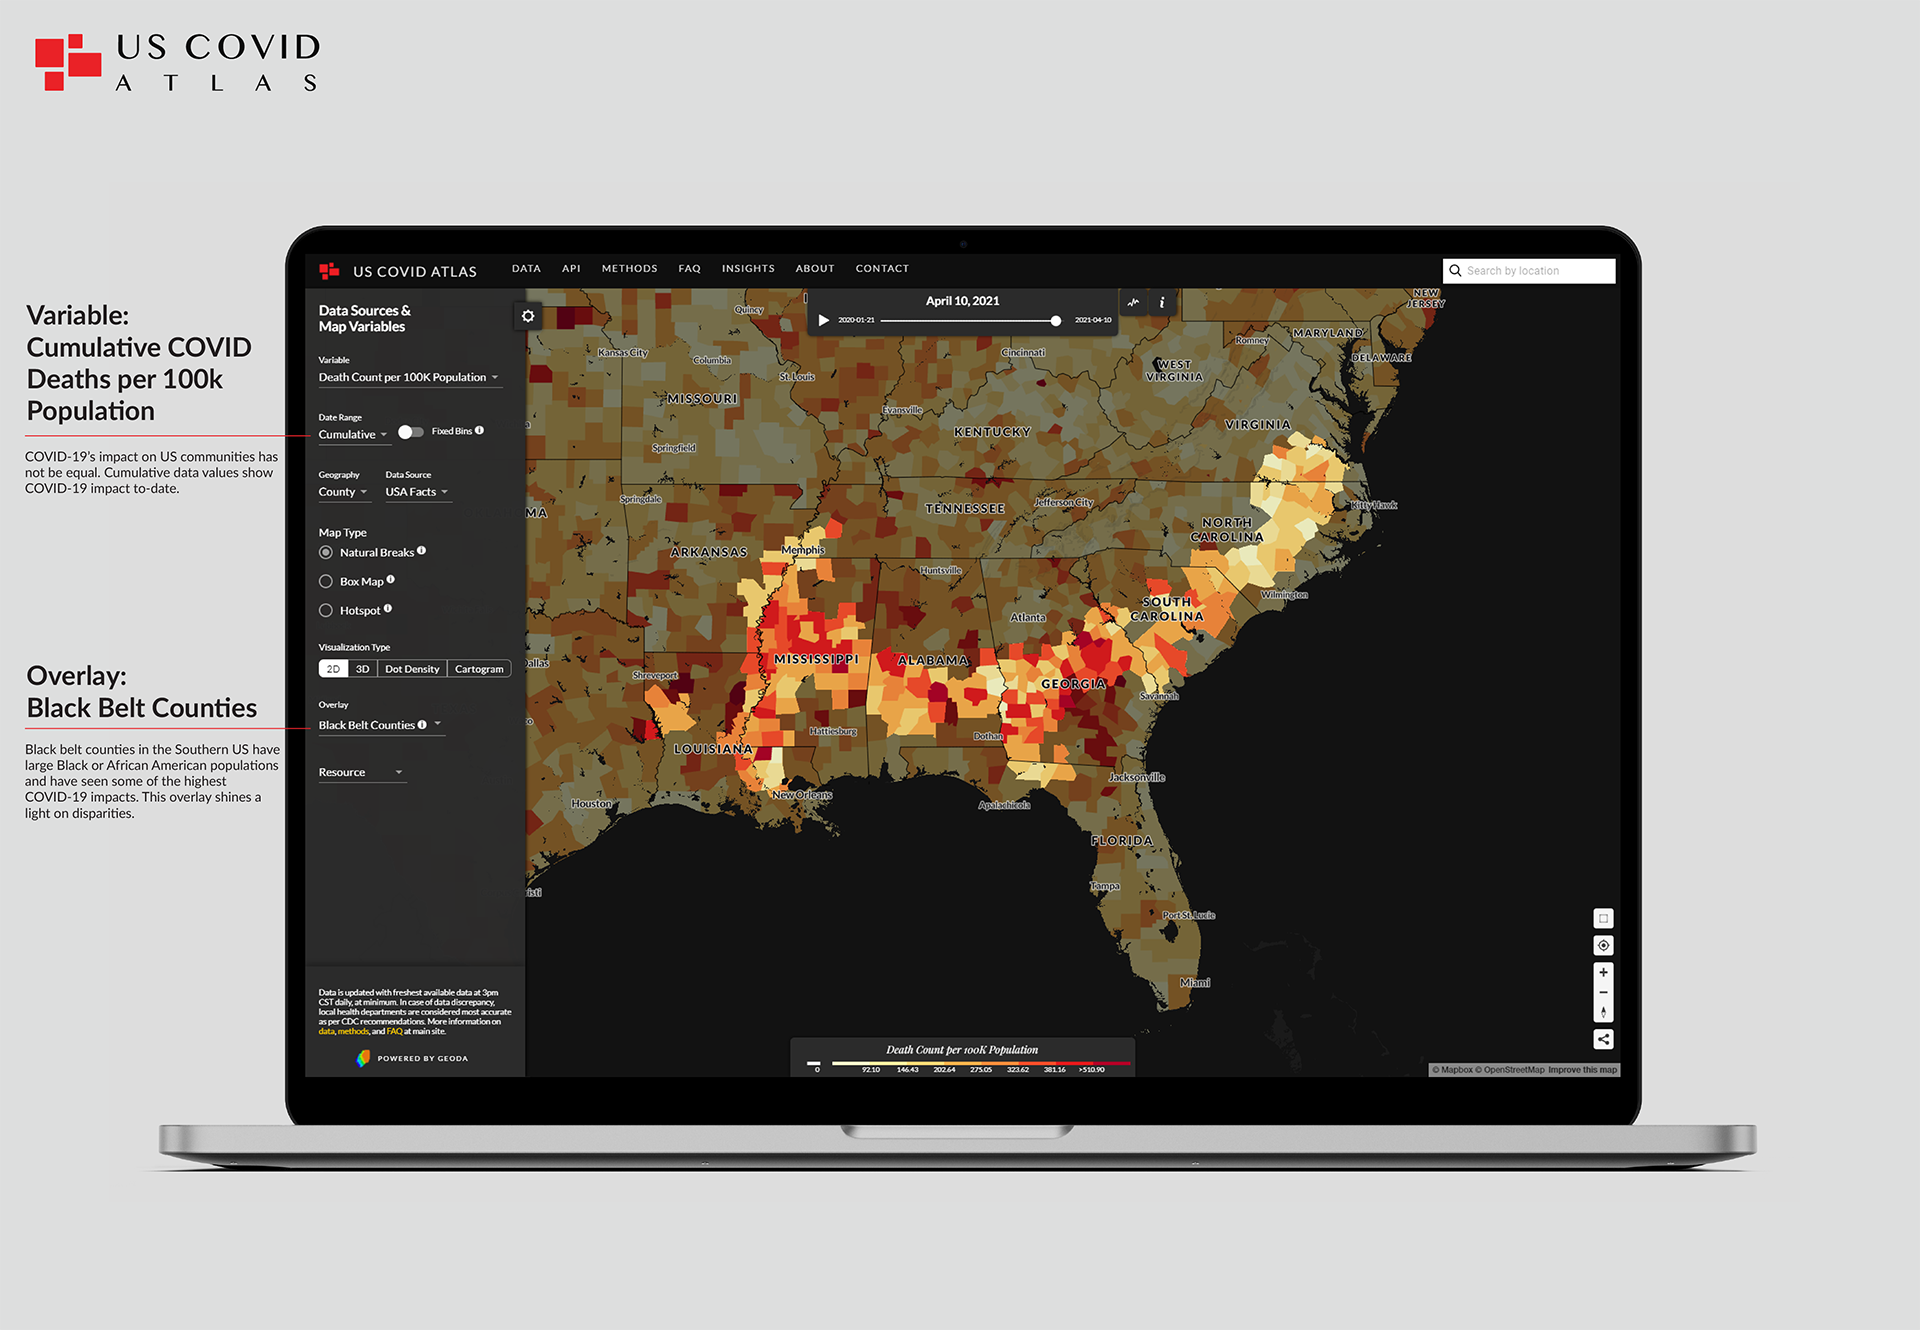
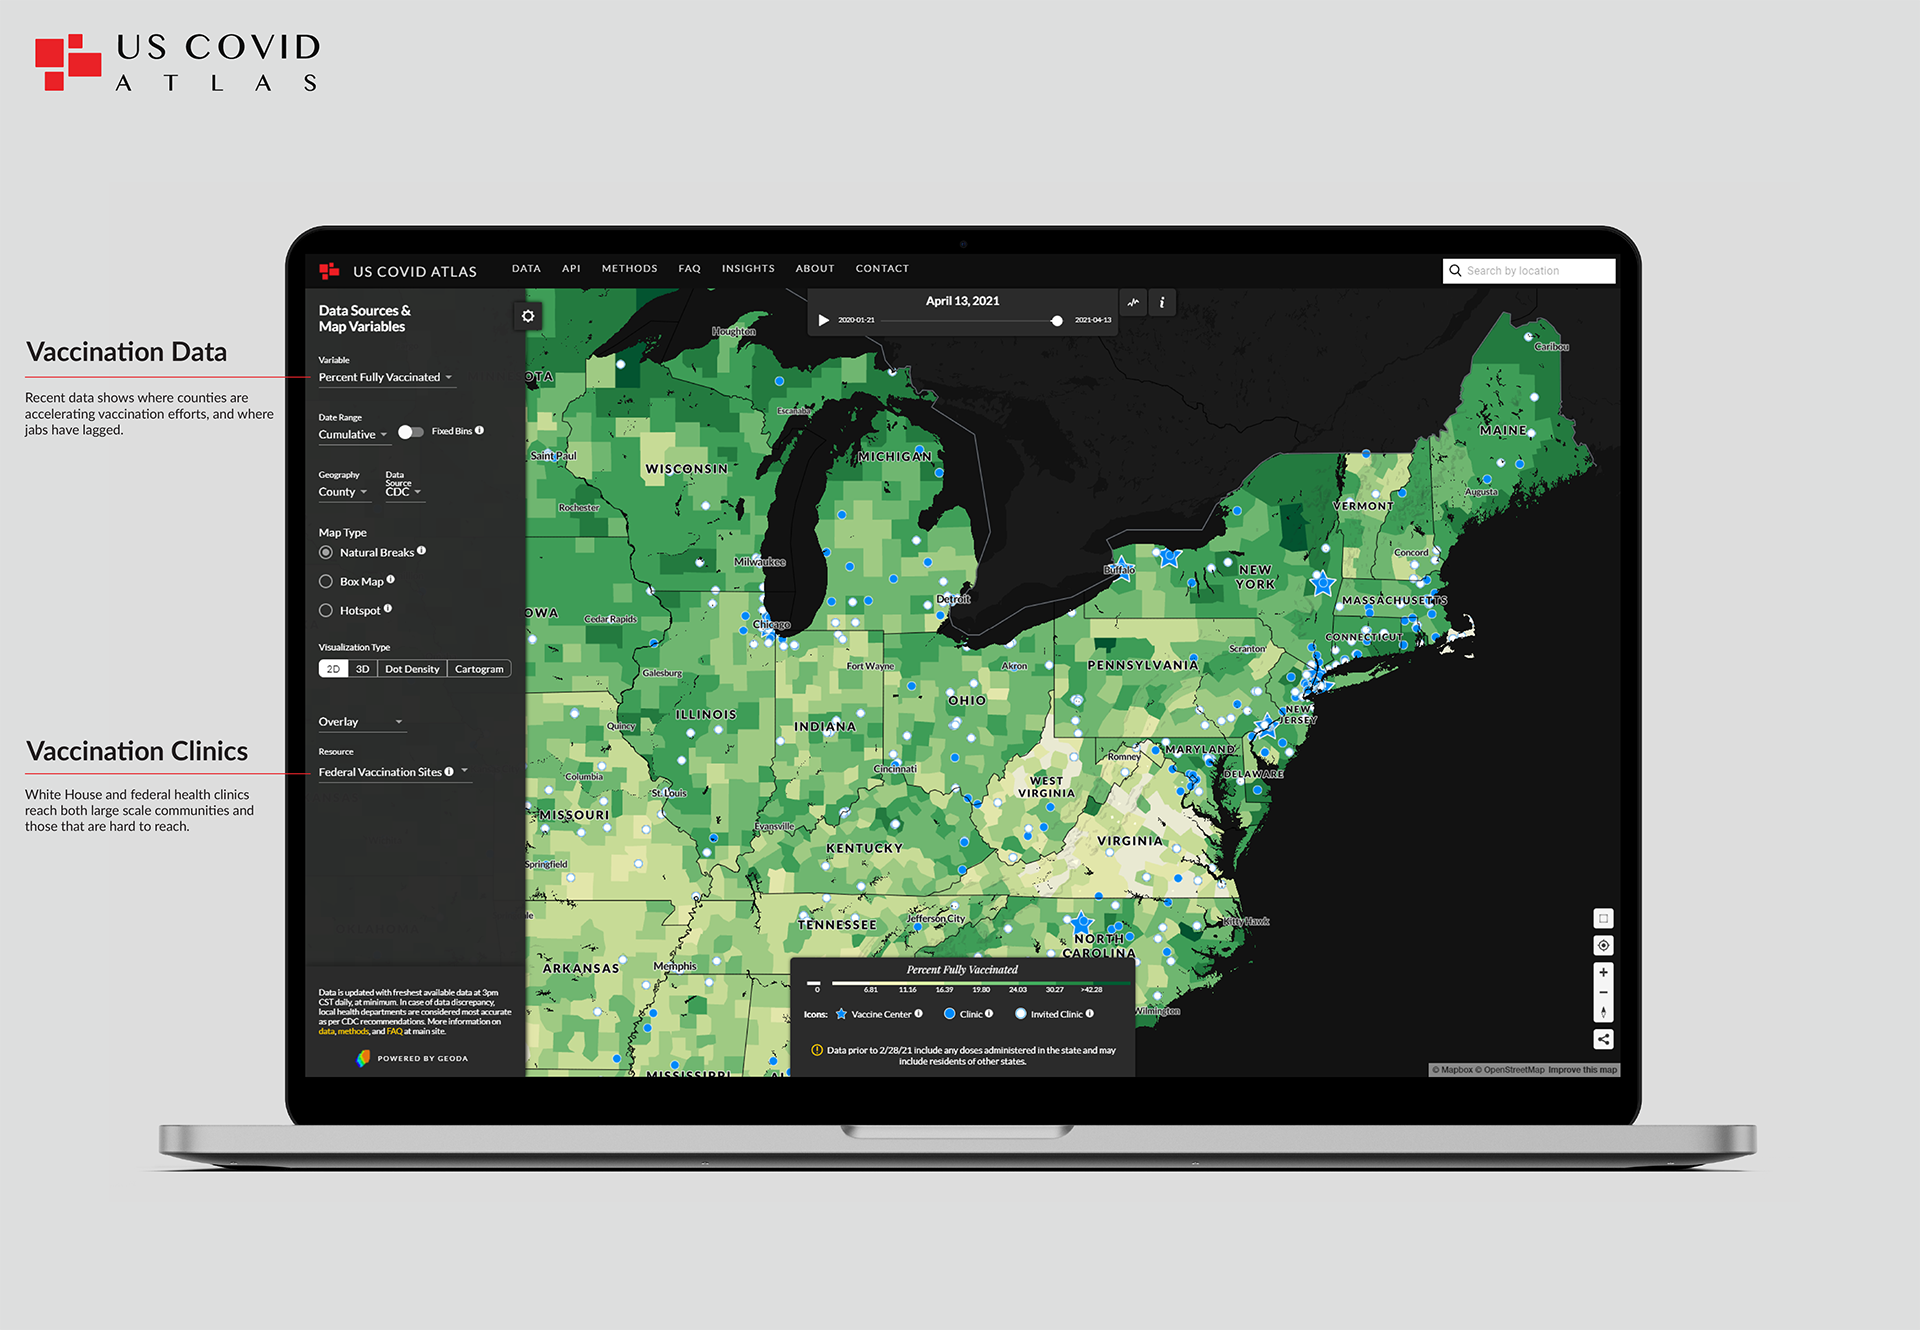
Datasets included range from cases, deaths, and testing to vaccinations and community/equity indicators. Communities hit particularly hard are highlighted on the map.
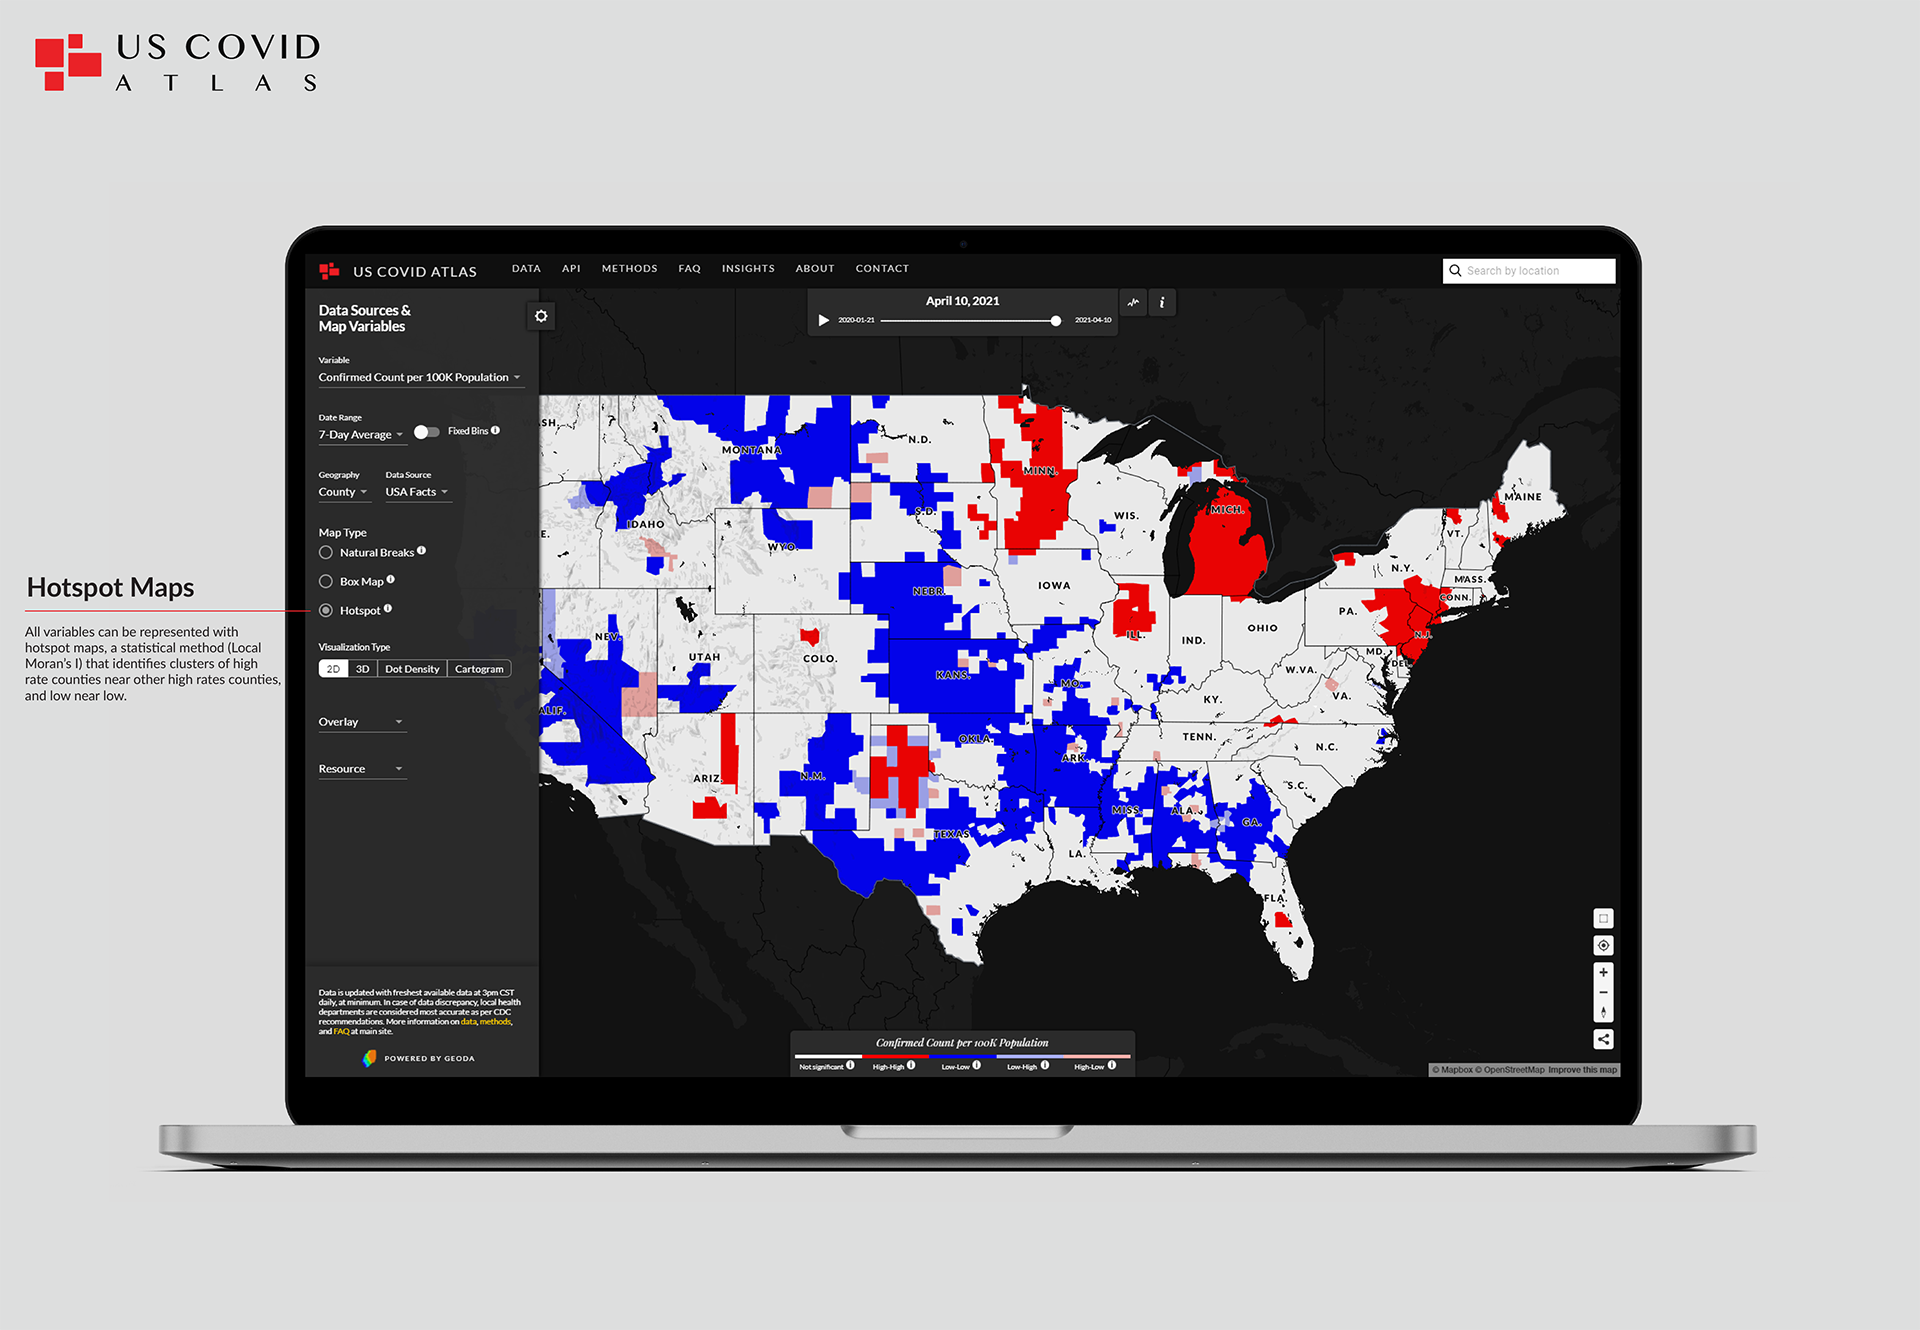
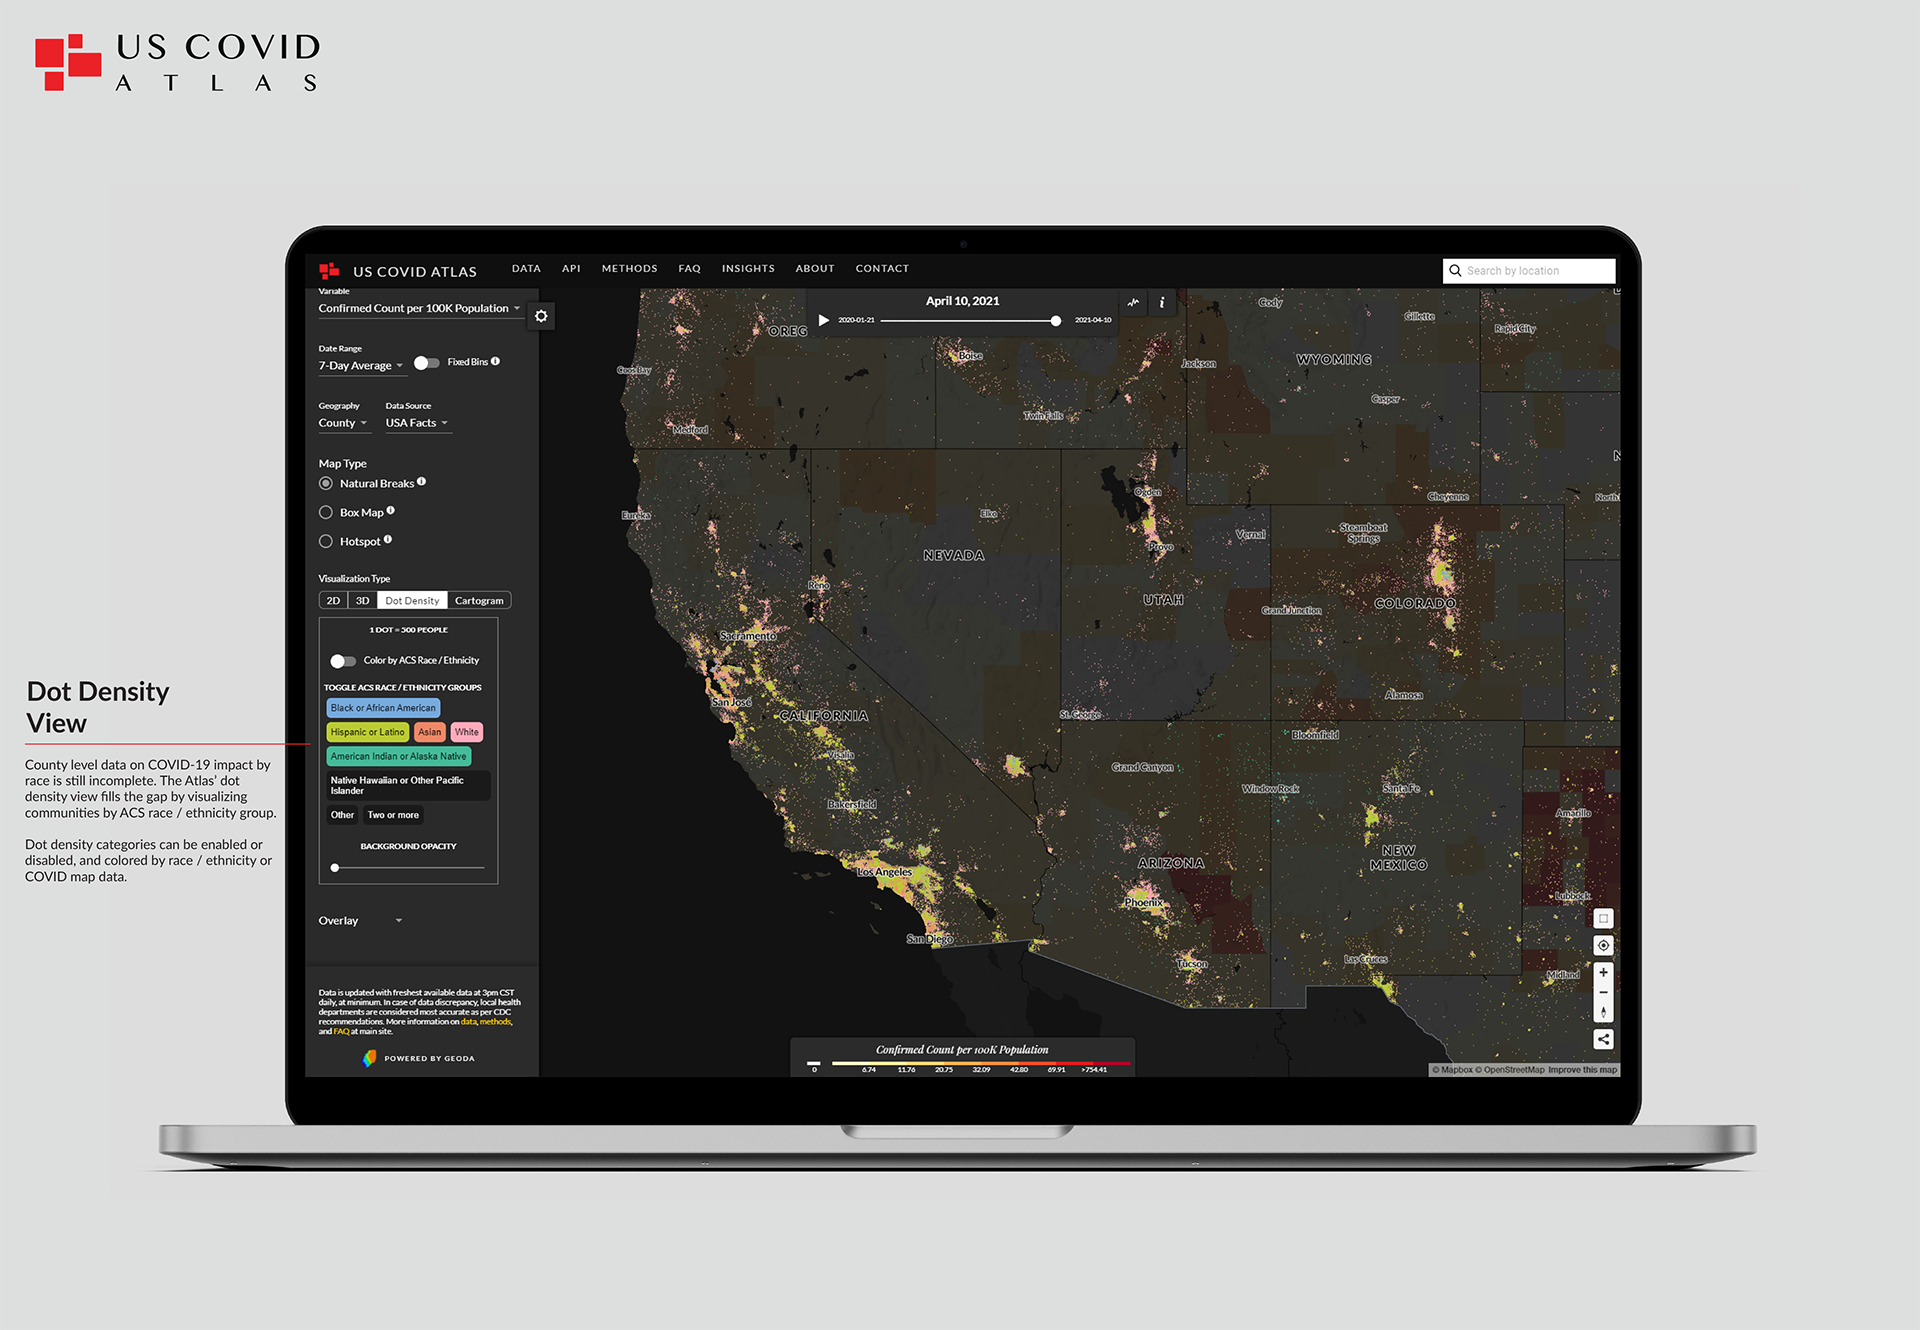
In-browser analytics enable hotspot mapping of any variable across any time range, powered by UChicago CSDS' library jsgeoda.
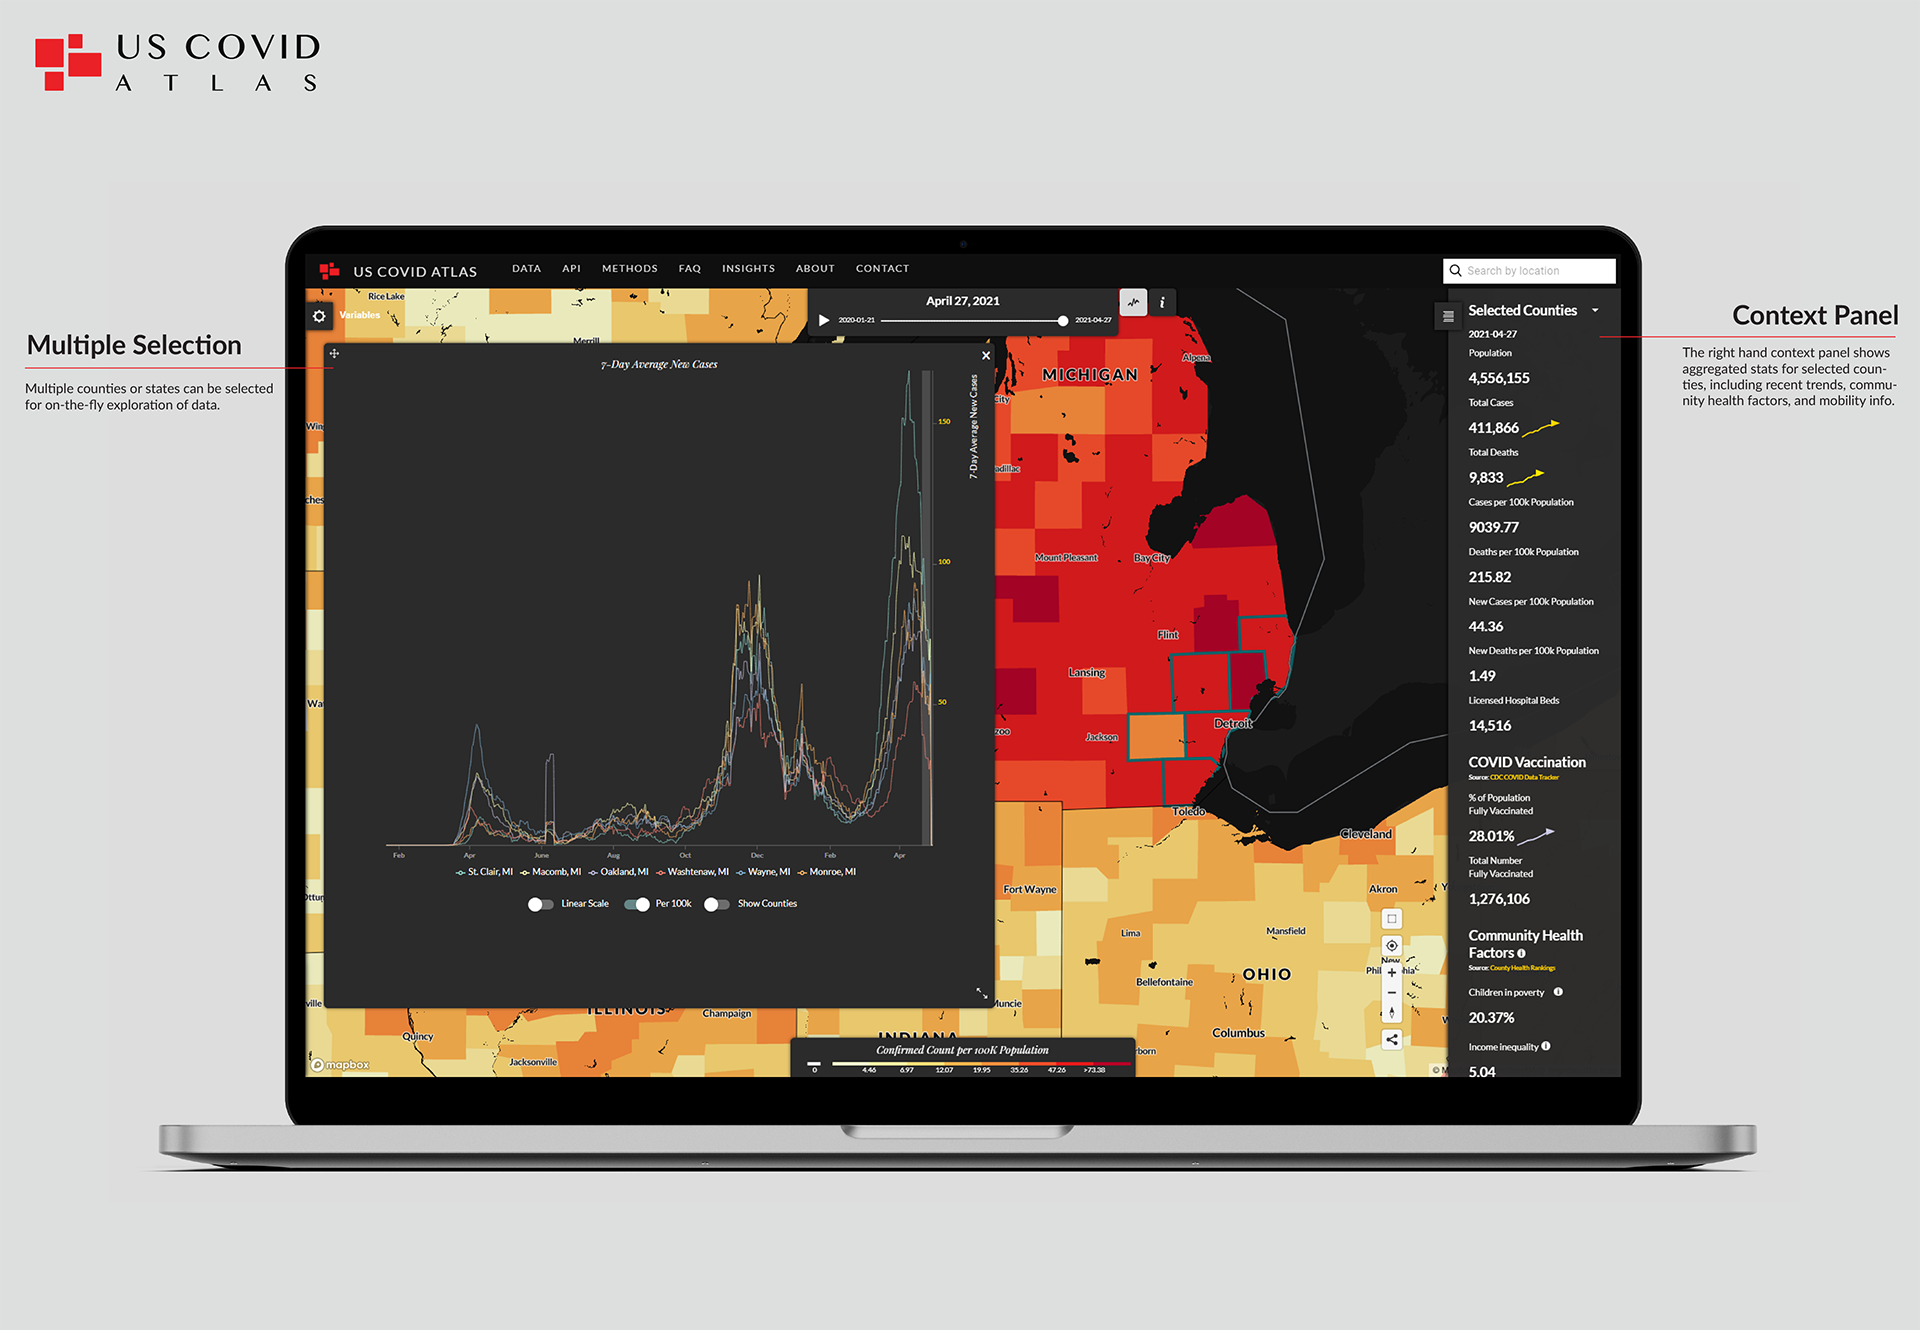
User can summarize their own areas of interest by selecting multiple counties over a time range, plugging in custom data, or generating unique customizable reports.
See more at uscovidatlas.org.