Moving in Nairobi
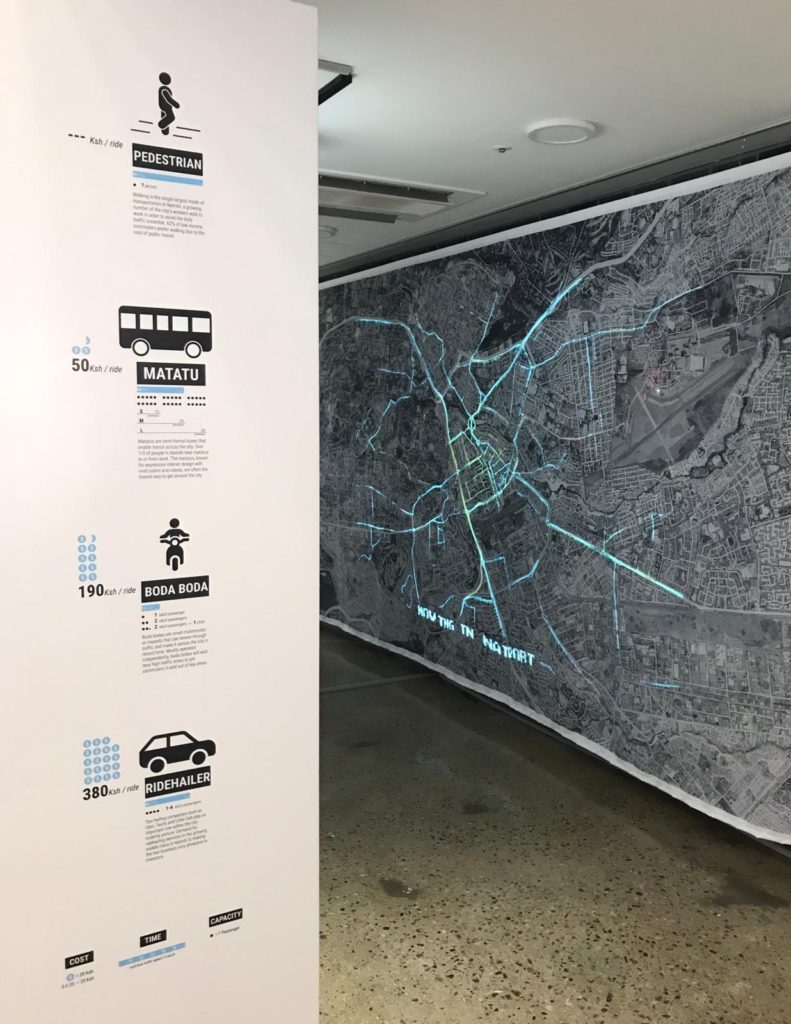
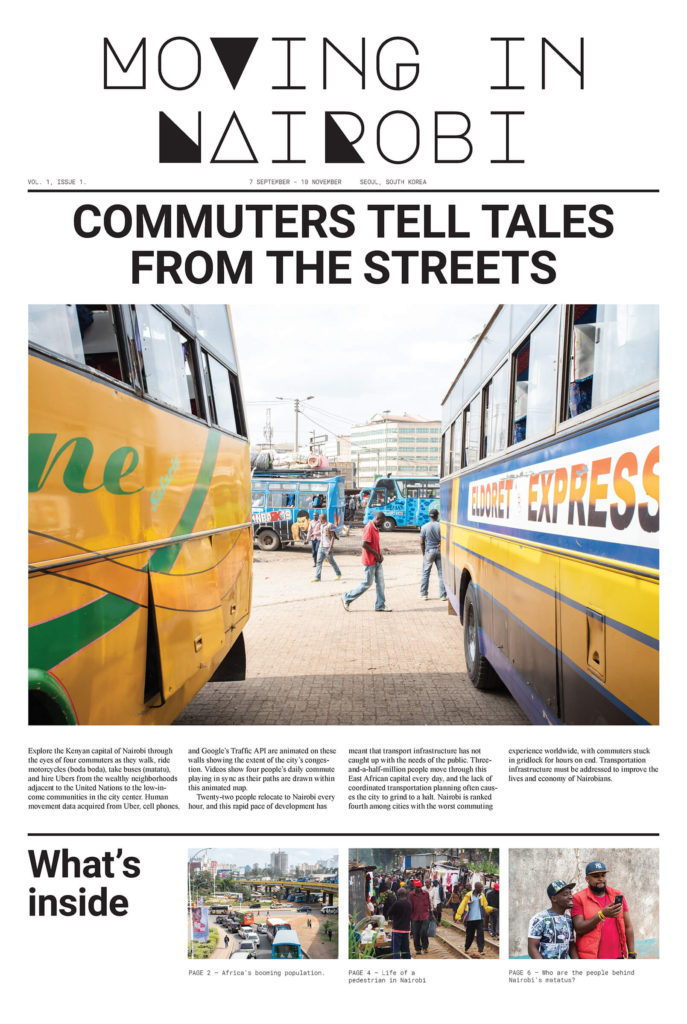
- Purpose: Moving in Nairobi was an exhibition that took place during the 2019 Seoul Biennale of Architecture and Urbanism in Seoul, South Korea. The installation contained four 1-channel videos, wall graphics and portraits, a newspaper, and a projected data visualization of a 24 hour traffic cycle in the city.
- Role: Exhibition Design, Development, Graphic Design
- Outcomes: Animated Video (Deck.gl, React, Adobe Premiere), Simulated Routes and Traffic (OSRM), Exhibition Newspaper (Illustrator, Indesign)
- Context: Project by Civic Data Design Lab (Sarah Williams)
Description
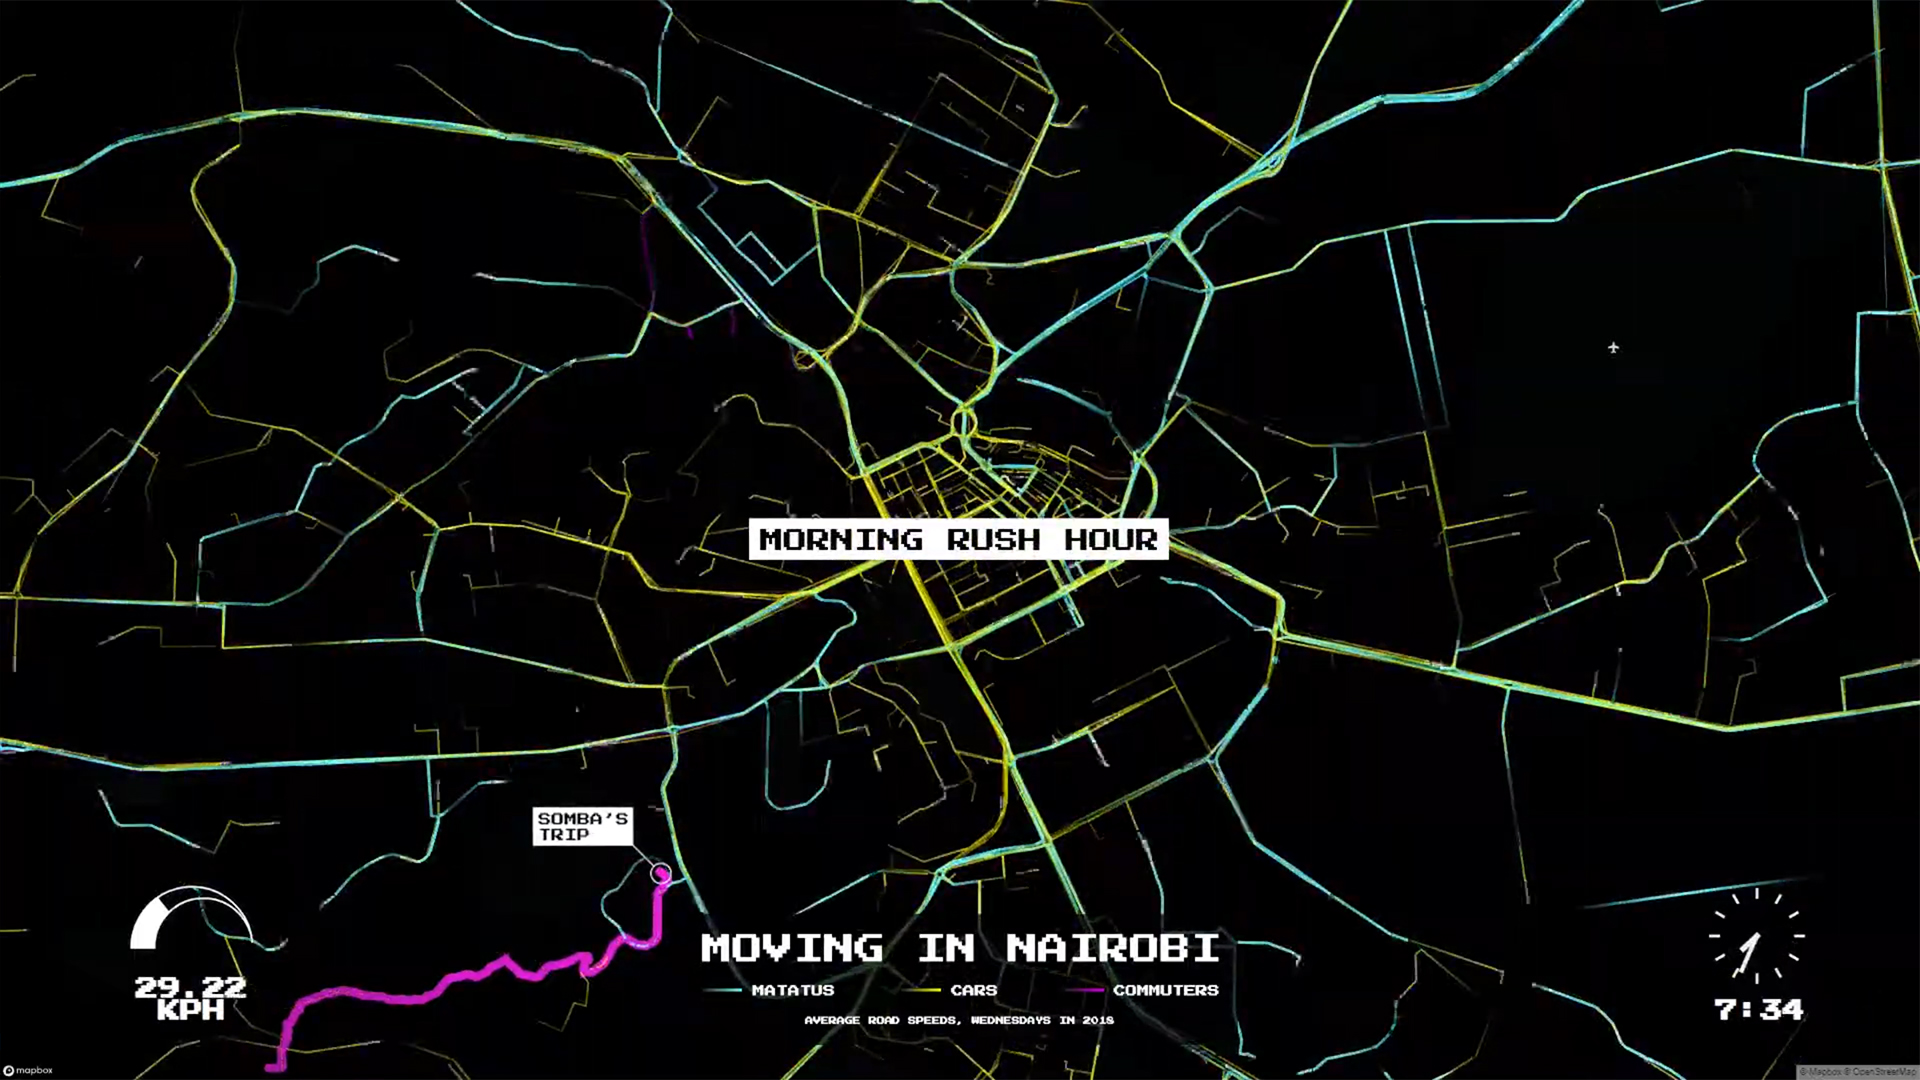
Moving in Nairobi was an exhibition that took place during the 2019 Seoul Biennale of Architecture and Urbanism in Seoul, South Korea. The installation contained four 1-channel videos, wall graphics and portraits, a newspaper, and a projected data visualization of a 24 hour traffic cycle in the city.
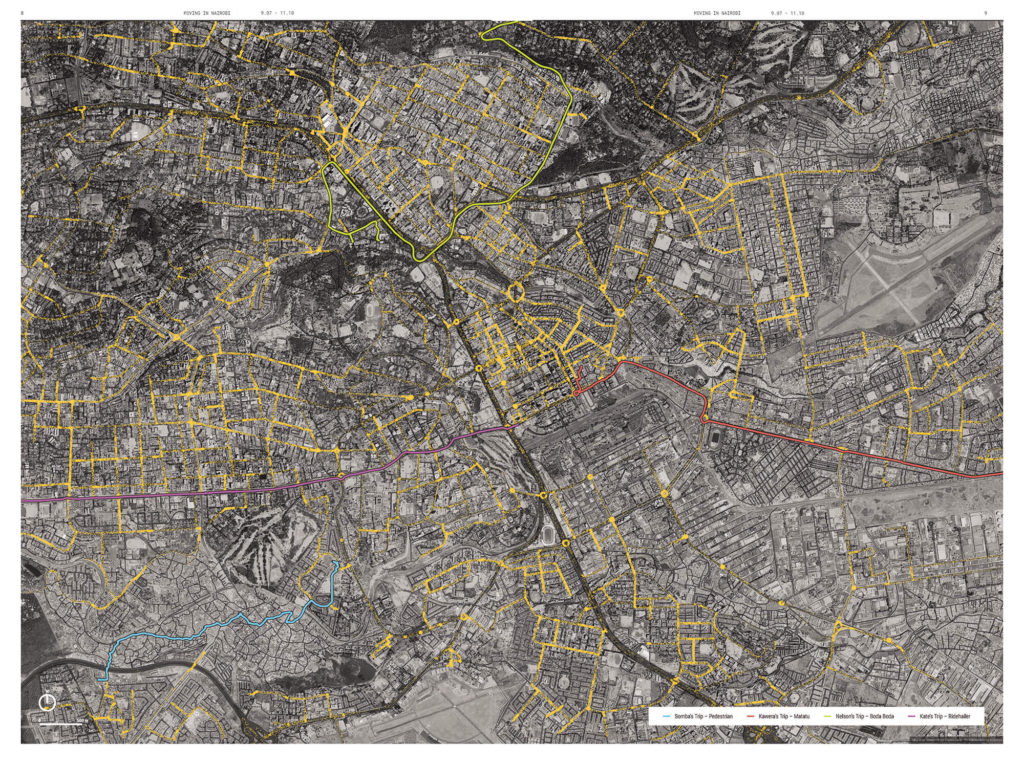
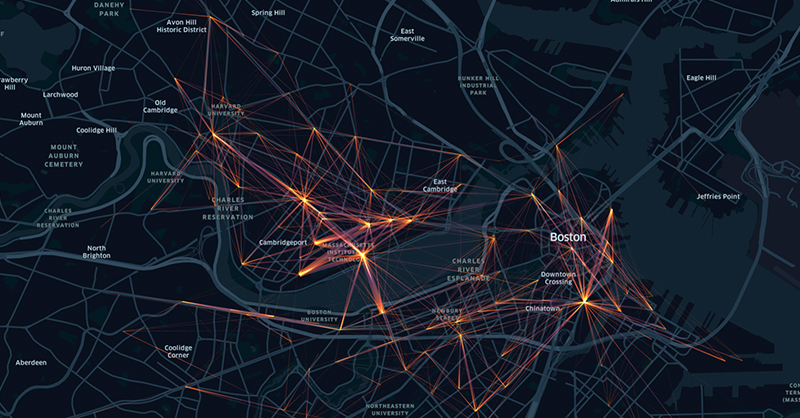
I contributed broadly to many parts of the exhibition layout and design. My specific contribution was the execution of the video data visualization of traffic. The data visualization started with traffic count data from a University of Nairobi study, Google Places points of interest, and Uber Movement traffic speed data. Using Open Source Routing Machine (OSRM), trips were simulated at the volumes seen in the traffic count study between likely OD pairs. The car speeds were then slowed according to the Uber Movement data, interpolated between the two hour data points for smooth speed transitions. Additionally, GTFS data was parsed for the informal buses called “matatus” and anecdotal GPS traces from GoPro videos were included for the four participants featured in the exhibition.