Adding a Denominator to Bike Safety
- Purpose: This project worked to find better context for bike safety in Boston-Cambridge, MA. Bike crashes are often standalone numbers, so we used bike-share data to understand the flows of bicycle traffic and see how many bike crashes per riders occured, adding a denominator to the statistics.
- Role: Project Concept, Statistical Analysis and Data Handling, Web Maps
- Outcomes: Geosaptial Analysis (Python Pandas, Geopandas, QGIS), Big Data Routing (OSRM), Interactive maps (Kepler.gl) and project website
- Context: Graduate Coursework with City of Boston Partners
Description
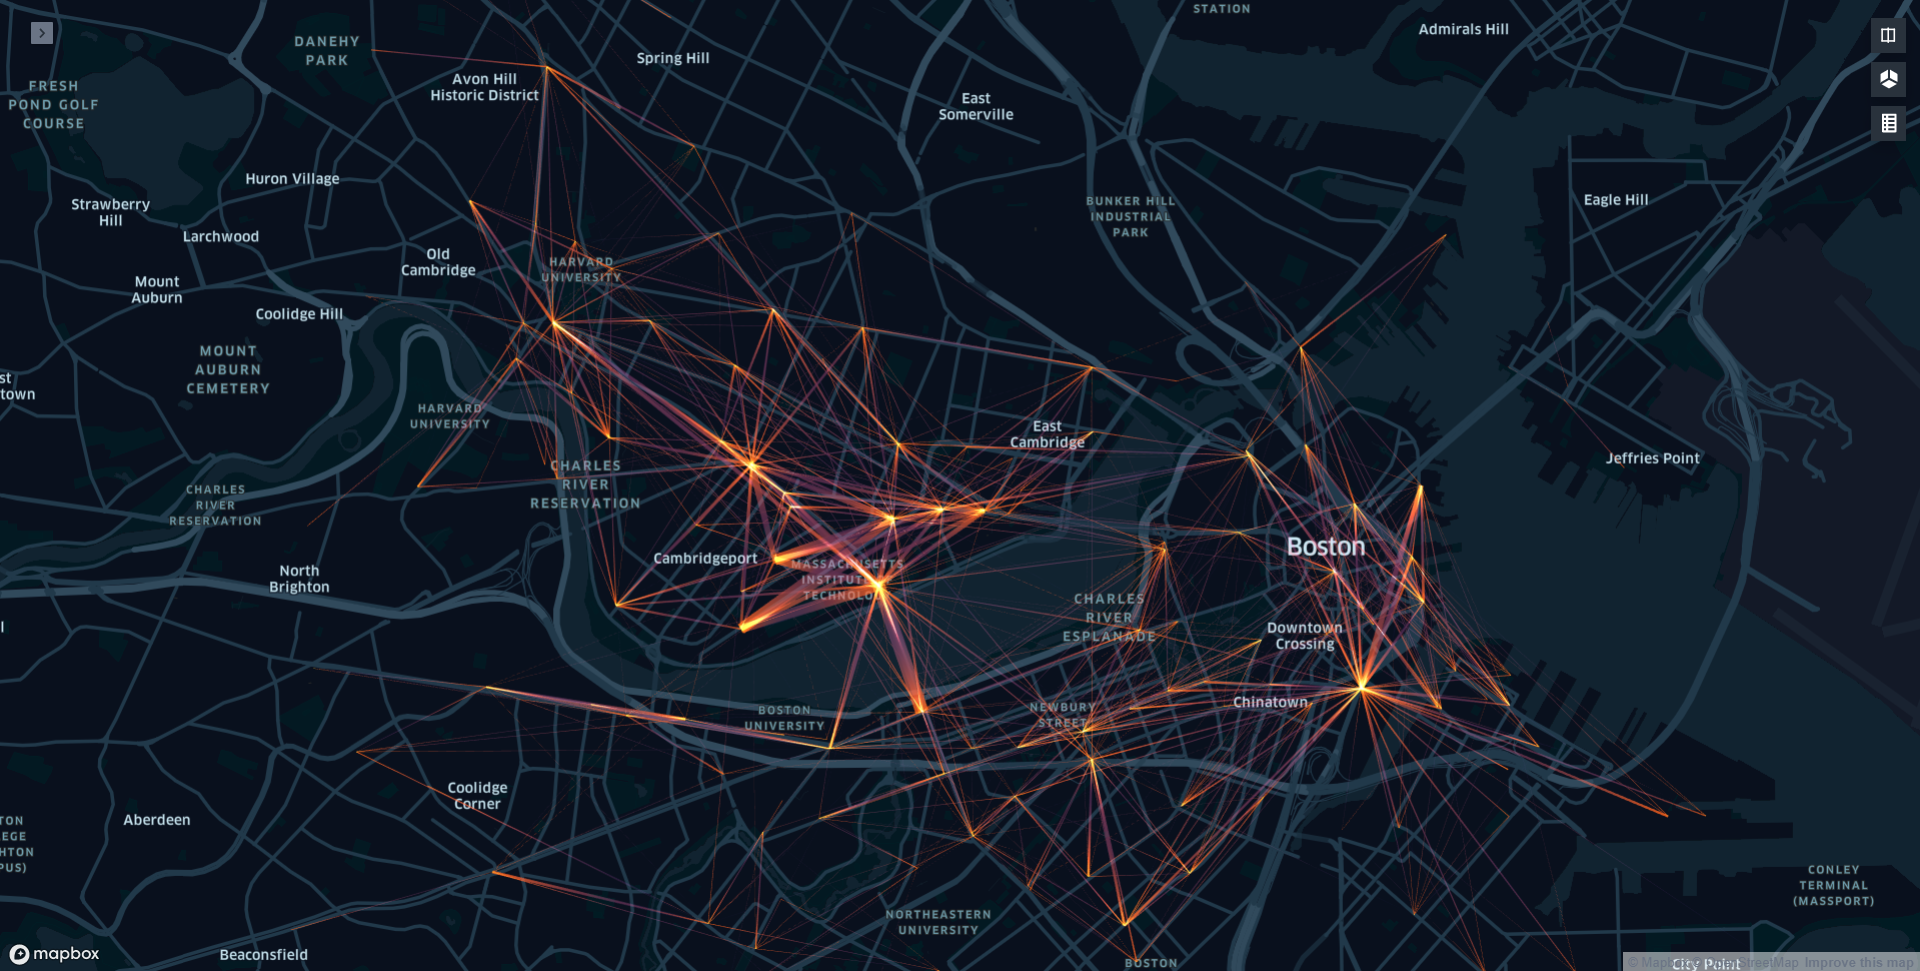
As part of the Fall 2019 course, Applied Urban Analytics, this project sought to add a denominator to bike crash information. Instead of “10 crashes occurred at this intersection,” this project worked towards understanding how many crashes per 100,000 riders at such an intersection. To do this, along with Annie Hudson (MIT DUSP) and Sue Kim (Harvard GSD), used open data from the bike share system in Greater Boston to estimate ridership across the city.
The origins and destinations (OD) were routed using Open Source Routing Machine (OSRM) and the weighted based on trip numbers between OD pairs. See more on methods here.
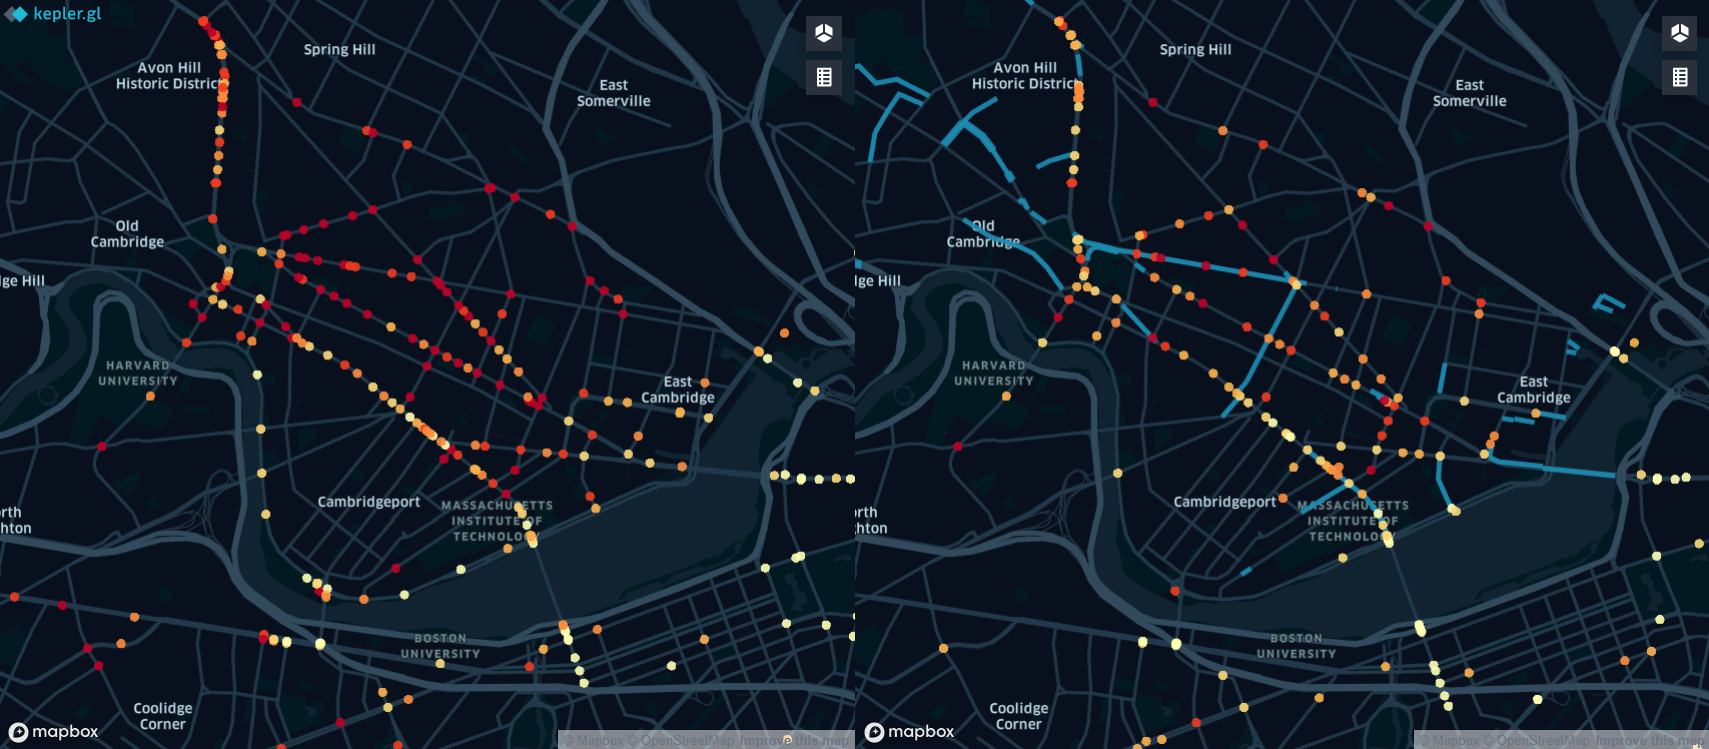
Major changes before and after interventions (such as adding bike lanes) and key intersections of high crash rates were binned in high, medium, and low-frequency data. Key findings suggest some relationship gas stations, intersections with changes in road types (eg. small to large road), and simple but non-signalized intersections.
See the site at bikes.wrong.website.